
Hi Everyone Hope you all are doing good! In this video I am talking about the following three methods of adding your PVA on Power Apps Portals. All super easy. Embed HTML CodeAdd an IframeCustomised canvas, index.html (https://docs.microsoft.com/en-us/power-virtual-agents/customize-default-canvas?WT.mc_id=BA-MVP-5003605 ) Watch the video here: https://youtu.be/ADVltnmDBwY Hope it helps! See you in the next one!

Power Virtual Agents-Bot Variables, Multi-Language and working in a Solution
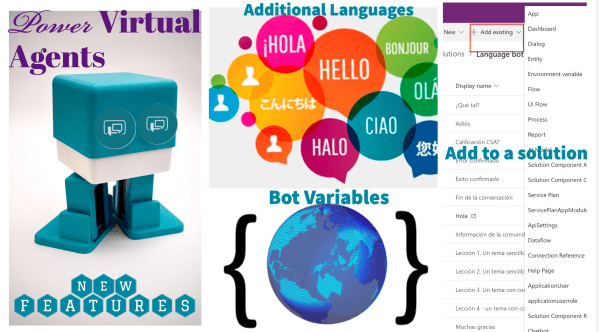
Hi Everyone In this video, I am talking about three new features that were released between April-May 2020. Bot Variables/Global VariablesSupport for additional languagesAdding your chatbot to a Power Apps solution Bot Variables- The new variables allows you to select one of the two options; local or bot. if use select local then you can... Continue Reading →
Share this:

Why use emojis in Power Virtual Agents?

Hello Everyone Hope everyone is keeping safe! In this blog we are going to talk about emojis in Power Virtual Agents. We will also touch upon GIFs and images but mostly Emojis. First of all, if you were not aware that you can use emojis in PVA, I am telling you can and that too... Continue Reading →
Share this:

Agent, Power Virtual Agent – Episode 7: Customer Identification Process In PVA
Hello Everyone Hope you’re all keeping safe. For information on how to keep yourself safe from COVID-19 visit https://www.who.int/emergencies/diseases/novel-coronavirus-2019/advice-for-public This is the last episode of Agent, Power Virtual Agent series. Playlist here This episode of Power Virtual Agents (PVA) is about how to identify and verify your customers in PVA. In Episode 5 we looked at... Continue Reading →
Share this:

Agent, Power Virtual Agent – Episode 6: Configuring Channels (Custom Website & Microsoft Teams)
Hello Everyone Hope you’re all keeping safe. For information on how to keep yourself safe from COVID-19 visit https://www.who.int/emergencies/diseases/novel-coronavirus-2019/advice-for-public This episode of Power Virtual Agents (PVA) is about how to configure channels in your PVA. This is #thenocodeway to leverage the power platform. Following steps are required: Custom Website Go to Channels --Custom Wesbite Copy embed... Continue Reading →
Share this:

Agent, Power Virtual Agent – Episode 5: Step by Step Authentication
Hello Everyone Hope you’re all keeping safe. For information on how to keep yourself safe from COVID-19 visit https://www.who.int/emergencies/diseases/novel-coronavirus-2019/advice-for-public This episode of Power Virtual Agents (PVA) is about how to authenticate users in your PVA. This is #thenocodeway to leverage the power platform. Following steps are required: Go to Manage and click 'Authentication'Pre-filled and optional fields... Continue Reading →
Share this:

Agent, Power Virtual Agent- Episode 4: Variables and Power Automate Actions
Hello Everyone Hope you’re all keeping safe. For information on how to keep yourself safe from COVID-19 visit https://www.who.int/emergencies/diseases/novel-coronavirus-2019/advice-for-public This episode of Power Virtual Agents (PVA) is about understanding ‘Variables’ and 'Calling an Action' using Power Automate in PVA. This is #thenocodeway to leverage the power platform. Following is covered in the video: Variables Dynamics content... Continue Reading →
Share this:

Agent, Power Virtual Agent- Episode 3: Understanding Entities
Hello Everyone Hope you’re all keeping safe. For information on how to keep yourself safe from COVID-19 visit https://www.who.int/emergencies/diseases/novel-coronavirus-2019/advice-for-public This episode of Power Virtual Agents (PVA) is about understanding 'Entities' in PVA. This is for us #nocodemonkeys to leverage the power platform. Following is covered in the video: Entities in PVATo better understand a user’s intent... Continue Reading →
Share this:

Agent, Power Virtual Agent- Episode 2: Understanding Topics
Hello Everyone Hope you’re all keeping safe. For information on how to keep yourself safe from COVID-19 visit https://www.who.int/emergencies/diseases/novel-coronavirus-2019/advice-for-public This episode of Power Virtual Agents (PVA) is about understanding 'Topics' in PVA. This is for us #nocodemonkeys to leverage the power platform. Following is covered in the video: What are topics?How do you want the conversation... Continue Reading →
Share this:

Agent, Power Virtual Agent- Episode 1: Getting Started
Hello Everyone Hope you're all keeping safe. For information on how to keep yourself safe from COVID-19 visit https://www.who.int/emergencies/diseases/novel-coronavirus-2019/advice-for-public This episode of Power Virtual Agents (PVA) is about how to get started? https://youtu.be/JrX2K4_81RE This is going to be a short episode as Microsoft makes it easier to build chatbots for people who don't know programming... Continue Reading →

